TYPICAL STATS CAN PRESENTATION OF
EMPLOYMENT AND UNEMPLOYMENT PICTURE ( FEB. 10, 2006):- (click BACK button in your web browser when you have
finished looking at it)
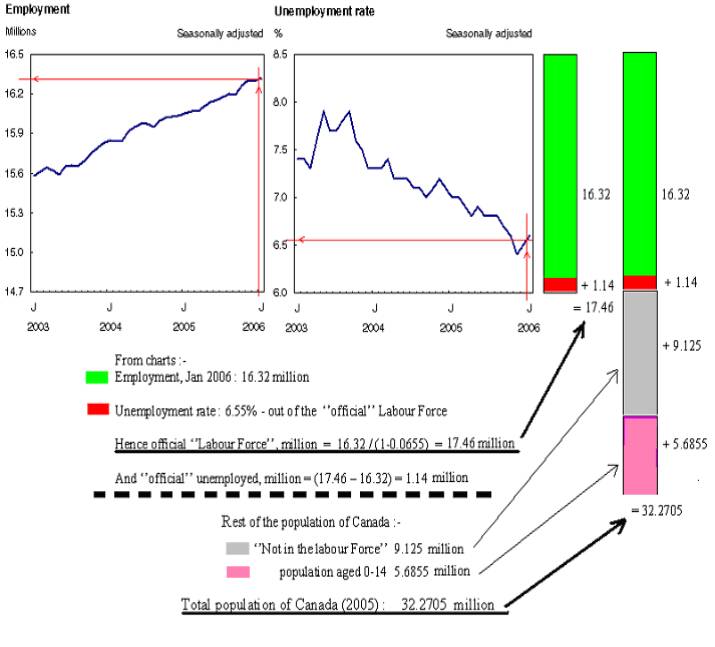
Now click HERE to see it. Note especially the two charts: they show only the numbers officially employed (Employment) and the official unemployed (Unemployment rate).
We need a little more information and analysis to get a clearer picture, which partly means considering the rest of the population :-
Reference URL as at Feb 23, 2006 :-
http://www40.statcan.ca/l01/cst01/famil01.htm
Total population, whole of Canada, 2005: 32,270,507
Figures below are in thousands of persons
Reference URL as at Feb 23, 2006 :-
http://www40.statcan.ca/l01/cst01/demo10a.htm
|
Population
by sex and age group |
||||||||
|
Total |
32,270.5 |
15,979.5 |
16,291.0 |
100.0 |
100.0 |
100.0 |
|
|
|
0–4 |
1,698.4 |
868.4 |
830.0 |
5.3 |
5.4 |
5.1 |
|
|
|
5–9 |
1,882.3 |
963.0 |
919.3 |
5.8 |
6.0 |
5.6 |
|
|
|
10–14 |
2,104.8 |
1,079.1 |
1,025.7 |
6.5 |
6.8 |
6.3 |
|
|
Working-Age Population (excludes persons aged 0-14) = Population aged 15+
From the table above, total population aged 0-14 = 5,685.5
Hence Population aged 15+ = 32,270.5 – 5,685.5 = 26,585
(again , these figures are for 2005)
For January 2006, if you now look at the figure below and read off the two graphs, we see that :-
1. The employment picture alone might be represented by the left-hand bar chart
2.
The whole population might then be represented by the right-hand bar
chart. The figure for the grey
part -Not in the Labour Force –
comes from the total population minus
the official labour force minus population aged 0-14
In terms of actual numbers of people
completely out of work, or
under-employed, several things do not appear in this kind of official
picture released each month :-
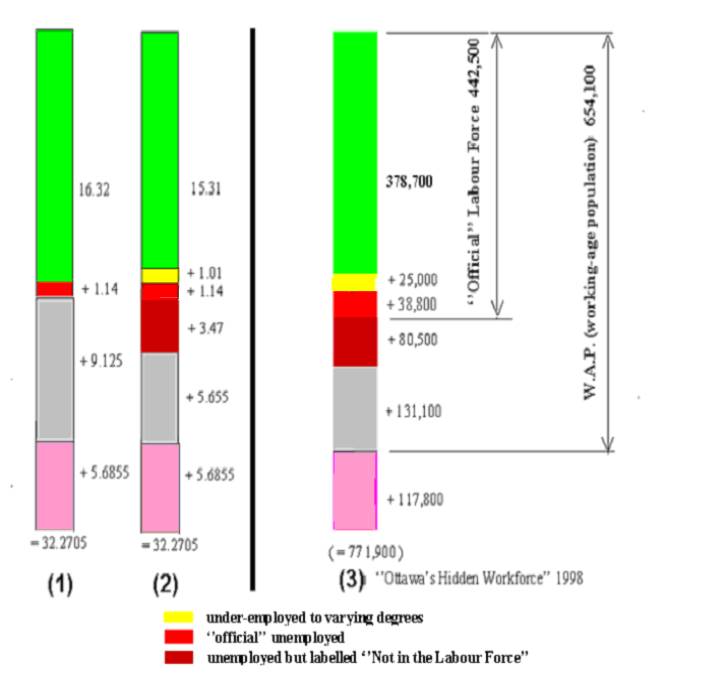
- Some people counted within the group Employment - 6.2%, based on Ottawa s Hidden Workforce of Fall 1998 - are under-employed to varying degrees. This was before the high tech slump started in early 2001. If this figure of 6.2%, which now might be too small, is applied to the whole of Canada, this means about 1.01 million people under-employed to varying degrees. The official definition Employed includes some people having as little as 1 hour per month of insurable employment, those employed full-time, and everyone else in between.
- Much more important in numerical terms, according to Ottawa s Hidden Workforce, an estimated 38% of the group Not in the Labour Force were people in practical terms unemployed - mostly discouraged workers and employable social assistance recipients. That means an estimated additional 3.47 million people actually unemployed, as at January 2006.
FULL REPORT – OTTAWA S HIDDEN
WORKFORCE (click the BACK BUTTON IN YOUR WEB BROWSER when you
have finished ) – now CLICK HERE to see it
If we now look at the three bar charts below, chart 2 is a bit more representative of the true picture; chart 1, already shown above, is repeated below for comparison.
Chart 3 represents the findings of Ottawa s Hidden Workforce 1998; the actual numbers of people are shown
Additional background and comments.
■ There is no question that this stuff about Ottawa s Hidden Workforce (1998) is true.
In fact, the then-R.M.O.C. Chair, Bob Chiarelli – now (2006) City of Ottawa Mayor Bob Chiarelli – challenged Ottawa area businesses to create 145,000 new jobs, through a newspaper article in The Ottawa Citizen on October 3rd, 1998.
■ There is reason to think that this was representative of what was happening in Ontario, and was approximately true for the whole of Canada
Consider these two newspaper articles which appeared in July 1995 :-
▪ One of them refers to 1.4 million official unemployed in the whole of Canada at that time.
▪ The second one refers to 1.3 million people receiving social assistance benefits IN ONTARIO ALONE. CLICK HERE
Ontario accounts for roughly 40% of Canada s total population, hence a rough estimate of the total number of such people in the whole of Canada at that time would be 2.5 times this, or 3.3 million. They were clearly in that position due to not having gainful employment. Yet these people were/are not included in the count of official unemployed. In fact, as you can now see, 4.6 million unemployed would have been nearer the truth. This of course assumes that the other provinces in Canada had the same percentage of people receiving social assistance; the truth would have been that some provinces were doing significantly worse, others a bit better than this.
This also does not include people in poverty but wanting to work and neither counted as official unemployed nor receiving social assistance benefits, due to not qualifying for some reason.
Since 1995, at least in Ontario, the rules for qualifying for social assistance have been tightened up which will have decreased the count of people getting it. But that does nothing to alter the true unemployment picture; it is not possible to simply make people disappear like this.
■ The current
(April 2006) extent of under-employment in Canada (the yellow parts in the charts above) may be much
higher than the 6.2% of people
officially employed indicated by
Ottawas Hidden Workforce
of 1998. A five-year study by Statistics Canada, reported in this newspaper article, indicates that AS
FEW AS ONE-THIRD of Canadians officially Employed (green or yellow) in the charts above) are working regular and normal
full-time hours, considered to be between 34 and 46 hours per week in the
report. The remaining two thirds are apparently in trouble with varying
degrees of under-employment, or subject to large fluctuations in annual working
hours, or over-worked; this is leading to severe stress and financial planning
/ budgeting difficulties for the people affected. In terms of numbers affected,
it seems as bad or worse than the hidden unemployed classed as Not in the Labour Force.
So the true picture is really something like THIS:-
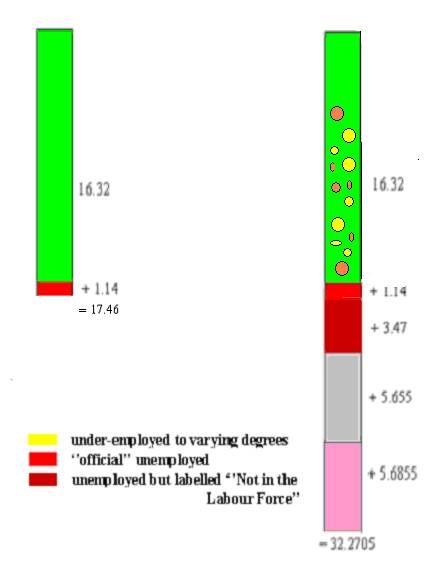
So the nice, neat
original Stats Can presentation, shown on the left, is really not
representative of reality, shown on the right. The official definition of employed
in Canada actually includes people with as little as 1 hour PER MONTH of
employment, as compared with full employment of between about 140 and
184 hours per month. The reality actually resembles a well-known type of waste
disposal system, with large bits of muck floating about in it.
Conversations in late 2005 between the author and Andrew Jackson, Chief Economist of the Canadian Labour congress, indicated that the Canadian Labour Congress sees under-employment as the major problem (as opposed to the hidden unemployment referred to above); based on this latest report from Statistics Canada, it is easy to see why. It indicates that as many as about 11 million working Canadians (2/3 times 16 million) could be in trouble over more-or-less severe under-employment.
This
same view is also evident in Mr. Jackson s May 2005 book, Work and Labour in
Canada: Critical Issues. EXCERPTS
- CLICK HERE
What seems clear from the above is that the problem may affect roughly three times as many people (11 million) as compared with hidden unemployed (about 3.4 million). However, the detailed information needed to arrive at an equivalent number of satisfactory full-time jobs , to solve the under-employment problem, does not seem to be available.
■ In Canada we occasionally
see reports from Statistics Canada, such as this one
in April 2004, which refer to
people out of work for a year or more as people who…may have given up
looking for work and dropped out of the labour force. This is bad reporting
and bad analysis because :-
(a)
It
can only give the impression that people in that position are defeatists
or drop-outs, that they are lazy, that there is …something
wrong with their attitude, or some such; further, such reports imply that
the people referred to don t need jobs because they are not
unemployed any more.
(b)
It
is not supported by any research and the assumptions behind the statement …may
have given up looking for work and dropped out of the labour force… are not
stated.
Further, the lack of comment in the
media observed by the author, concerning such statements, indicates that
everybody accepts such statements as fact without questioning them.
Further, it would also appear to
indicate that anyone who has lost a job (due, for instance, to being laid off)
is automatically categorized as Not in the Labour Force after being out
of work for a year, so as to remove them from the count of people in the official
unemployed category.
Then everybody continues to comment
on the incidence of child poverty in Canada and the difficulties that
foreign-trained professional immigrants have with getting work; with respect to
the latter, the difficulties reported always focus on problems with recognition
of foreign credentials, discrimination based on lack of Canadian experience
etc., whilst NOBODY recognizes the root cause of the trouble – lack of jobs
relative to the numbers applying, because nobody is aware of the numbers of jobs required.
Result : the whole Canadian
system behaves like the proverbial dog chasing its own tail – constantly
running after solutions but never attaining them, then failing to understand
why.
■ Statistics Canada occasionally admit that
the real number of unemployed is higher than the official
unemployed quoted in the monthly Labour
Force Survey. In this instance from 1998,
the actual unemployment rate is quoted as …in excess of 13%… when
people who ….have simply given up looking for work… are included, as
opposed to the official unemployment
rate of nine percent. This
higher figure still excludes employable social assistance recipients, among
others noted in Ottawa s Hidden Workforce of 1998 referenced above.